Cycling: Hour Record
The Hour Record
The hour record is a title held by the person who has ridden the furthest on a bicycle in one hour. Record attempts are carried out on an indoor velodrome, with the rider starting from a standing start and riding a single-speed time trial bike. Victor Campenaerts and Joss Lowden are the current men’s and women’s record holders.
Campenaerts set his record of 55.089km on the 16th April 2019 at the Aguascalientes Bicentenary Velodrome in Mexico. The previous record of 54.526km had been set in June 2015 by Bradley Wiggins in London. A talking point that got mentioned in the aftermath of this event was that the conditions were not favourable for Wiggins on the day, as a result of high air pressure. One would think that riding on an indoor track would be a controlled environment, but it is not. This is due to variations in air density, which was discussed by Dan Bigham (the main protagonist in this article) when he appeared on the GCN youtube channel.
As outlined in Dan Bigham’s blog, the main determining factors in an hour record attempt are power output, coefficient of aerodynamic drag (CdA), air density, rolling resistance and drivetrain efficiency. Power output is determined by the rider’s aerobic capacity. CdA is determined by the rider’s position and equipment. Drivetrain efficiency is solely determined by equipment and rolling resistance is affected by a combination of equipment and track surface. These four factors can be known to some extent before making an attempt, but air density is a function of the underlying atmospheric conditions which only be known on the day, namely temperature, humidity and atmospheric pressure. While temperature and humidity can be controlled to some extent within the velodrome (if you have the budget the blast the heating/humidifiers!), the pressure value is determined by a combination of the altitude of the location (think of the classic Science class example of boiling water on top of Everest) and the large scale weather patterns. Dan Bigham wrote in his aforementioned blog post that, provided the athlete is sufficiently acclimatised to the altitude, the trade-off of reduced air density versus reduced power output works in the athlete’s favour. But the variability of the weather patterns that determine surface pressure are not uniform around the globe, so the question is how much does it vary during a 30 year period at various velodromes?
So who the hell is this Dan Bigham anyway? He is a road and track cyclist with Ribble Weldtite Pro Cycling and Huub Wattbike, and has also worked as a consultant for teams including the Danish national team, Jumbo Visma and Canyon SRAM. When his fiance Joss Lowden broke the women’s hour record earlier this year, he also did a “UCI Unofficial” hour record attempt the following day at Velodrome Suisse in Grenchen; besting Wiggins’s distance and setting a new British record. He also stated that he has plans to do another attempt in the near future to try and break the record of Campenaerts, and has alluded to the possibility of travelling to altitude. He is quite open and transparent about his numbers and this, along with the resources of his blog posts, made him a perfect guinea pig for my calculations.
I have used a reanalysis dataset, a best-guess modelled estimate of past weather, called ERA5 to get surface pressure data for a variety of velodromes around the globe over 30 years. This is used to estimate the hour record distance that could be achieved by a Dan Bigham-shaped cyclist attempting an hour record at each velodrome and the variability of outcomes that could be expected at different locations. There are many caveats with this work and I will outline them first.
Disclaimer
- I have never set foot on a time trial bike.
- I have never ridden on a velodrome.
- I am not an expert on Siberian pine or what constitutes a “fast track”.
- I am not a aerodynamicist in any form. Just a nerd with a meteorology background, some curiosity and ability to code.
- I have made some substantial assumptions here in my calculations:
- I have assumed ideal conditions of 28 degrees celsius and 80% humidity for all attempts.
- Obviously this might not always be the case (just ask Ollie Bridgewood and his bitterly cold attempt in Newport).
- In this case I have assumed that the athlete has the ability/resources to control the HVAC system in the velodrome to make the conditions optimal, which simplifies the problem.
Data Overview.
- I have assumed the rider has a functional threshold power (FTP) of 365W. Dan said his FTP was in and around this value when he appeared on the Peak Torque youtube channel just after his recent attempt in Switzerland.
- I used the pressure on the day of his attempt from the nearby Meteo-Suisse weather station, along with the distance he achieved at Grenchen to reverse engineer a (rough) estimate of his CdA, which was used for later calculations.
- A list of velodromes was taken from wikipedia and I filled in any missing altitudes. Only indoor velodromes were considered here.
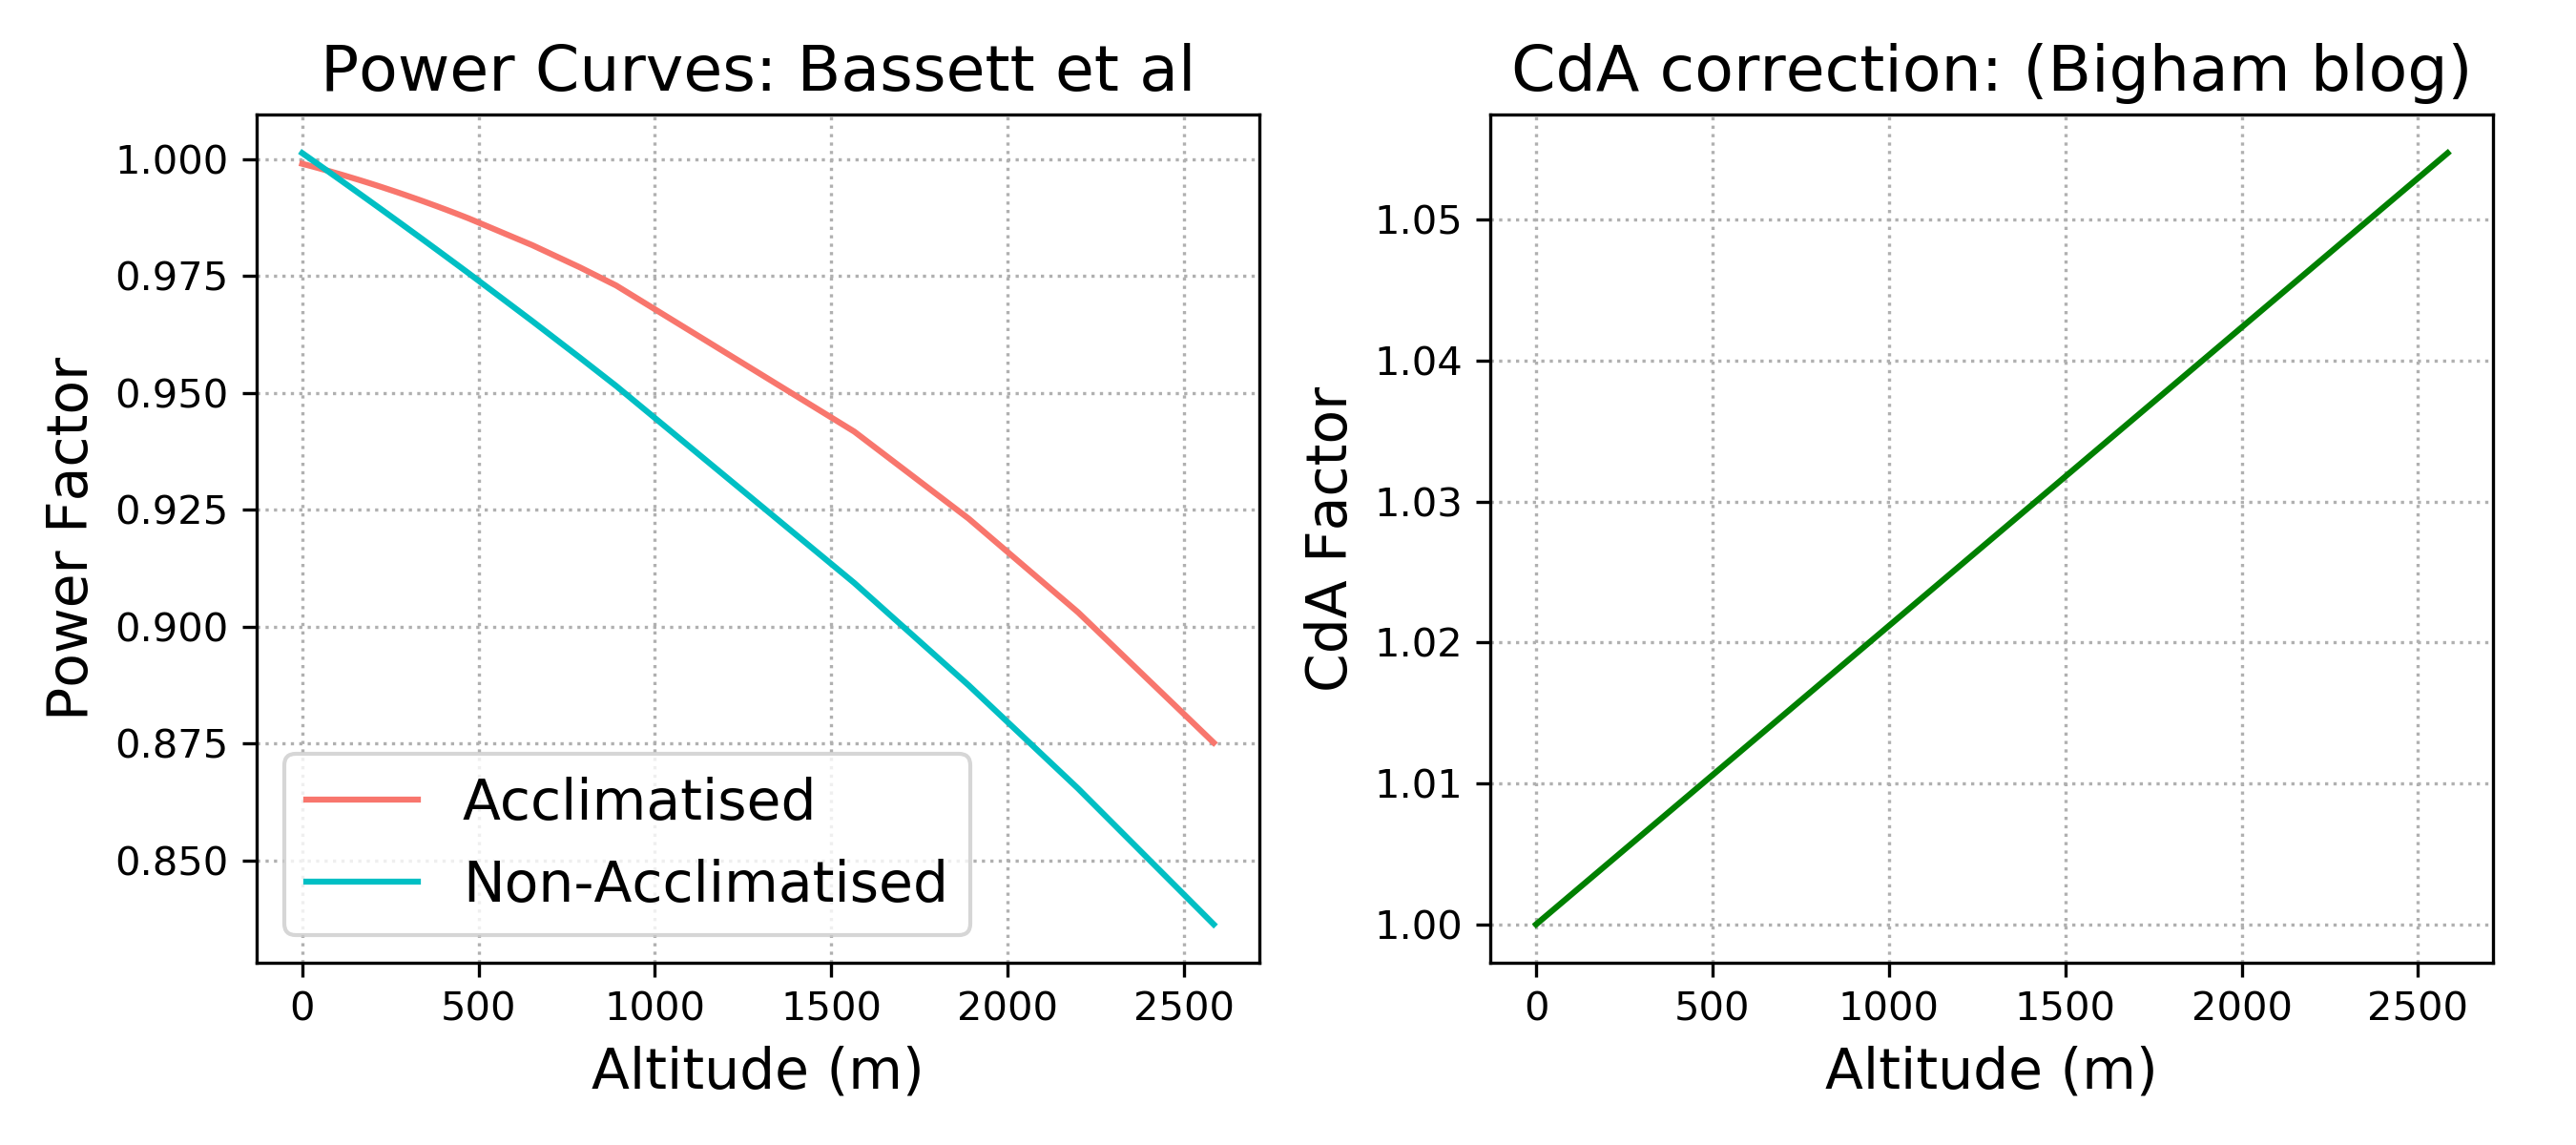
- Values corresponding to the Bassett et al paper were used to apply altitude corrections to FTP, shown in left plot below. I have mostly used the values for the acclimatised athlete, e.g. a 3% loss in FTP at 1000m altitude, although values for an unacclimatised athlete were also considered later in the piece.
- When writing about Ashton Lambie’s sub 4 miniute individual pursuit in his blog, Dan mentioned that CdA is also not consistent with altitude and increases with altitude; with a 4% increase at Aguascalientes. Dan kindly responded to my twitter message asking about his and informed me that the relationship was very non-linear and pointed me in the direction of this blog post by Vorteq about the design of their skin suit for Ashton Lambie’s IP, where a different suit specification was needed to optimise his CdA at altitude versus sea-level. Therefore the linear relationship that I have used, right plot below, is very likely to be incorrect but this was an attempt at some form of a first order approximation.
This information, along with the pressure data from a reanalysis dataset (outlined below) were used to calculate hour record distance.
ERA5
A reanalysis makes use of a technique called data assimilation to produce a gridded representation of past weather conditions. Data assimilation was developed as a method to take irregularly spaced recent weather observations and project them onto the regular grid. This allows observations to be used as input for a weather forecast model to determine the starting conditions of a forecast, which is then projected forward in time using numerical integration.
A reanalysis runs this technique repeatedly for decades of previous weather observations and generates a physically consistent “best estimate” of what the weather was in the past at locations which may not have observations. The are used for weather research, as well as weather-dependent sectors, such as assessing the viability of locations for wind farms etc.
The ERA5 reanalysis is the latest reanalysis dataset produced by the European Centre for Medium-range Weather Forecasting (ECMWF), and is available through the Copernicus Climate Data Store. Altough the full dataset runs from 1950-present, in the interest of time I downloaded 30 years worth of hourly surface pressure data (1990-2019) at the various velodromes mentioned earlier. The model surface elevation is not guaranteed to match reality (due to how topography is represented in the model), so this was also downloaded to apply a correction when large discrepancies were present between the velodrome altitude and the reanalysis grid-point elevation.
The surface pressure was used along with my assumed fixed internal temperature and humidity values inside the velodrome (28 degrees and 80% RH) to calculate air density for each hour. This was then used with standard equations for aerodynamic drag, rolling resistance and drivetrain efficiency to determine an hour record distance for that given hour. Each velodrome contained 271,752 different hour record distances which were used to plot the probability distributions of possible distances that could be achieved.
Overall Analysis
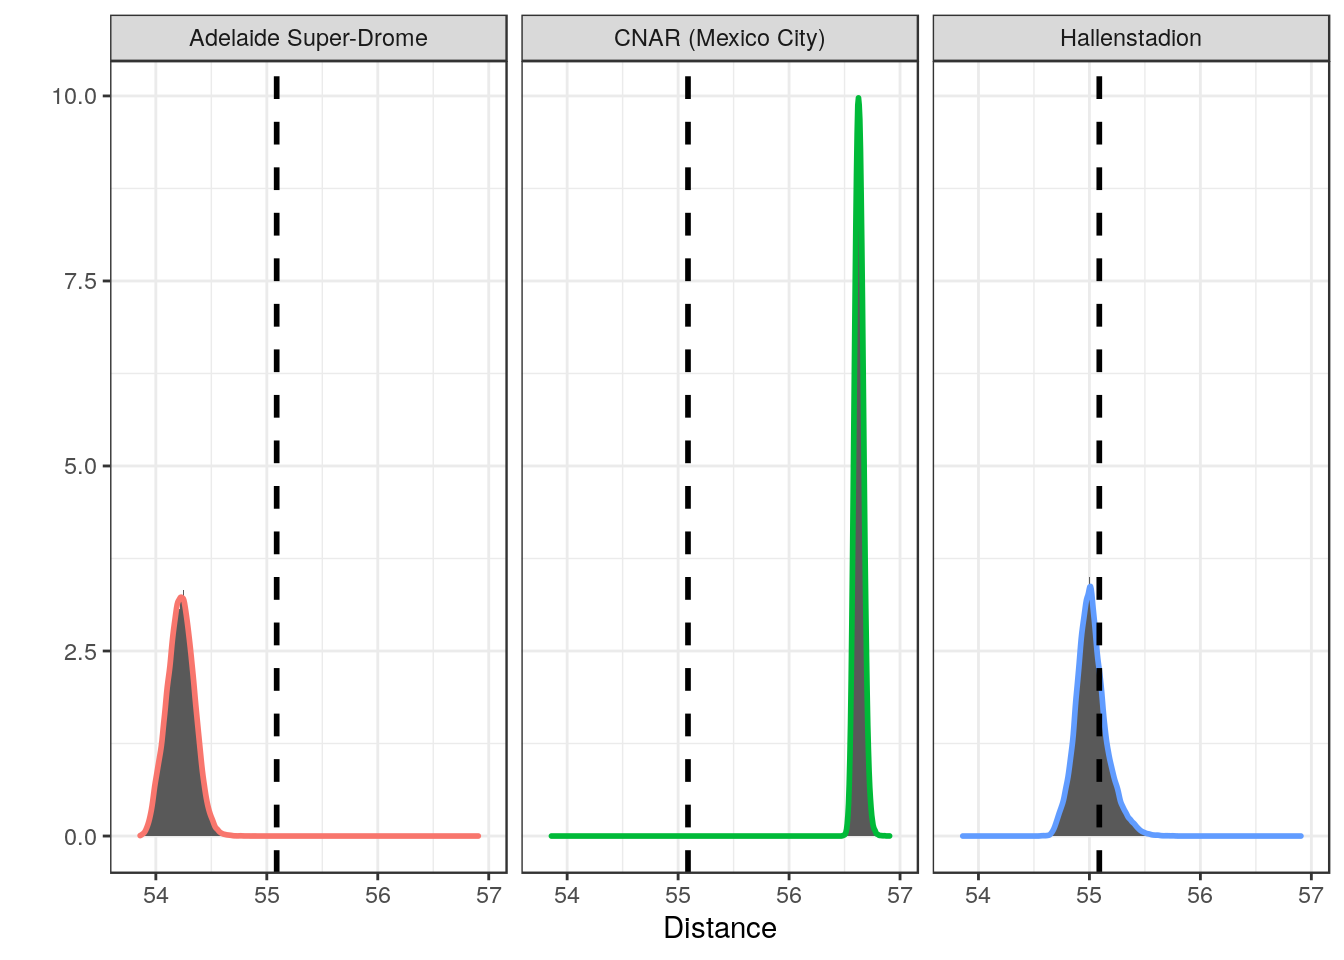
I will initially show some of my results in the form of histograms but I will then shift to using violin plots for the remainder of the article. Results are shown for Adelaide, Mexico City and Zurich to highlight the massive variations that can occur. In every plot for the remainder of the article, a black dashed line is used to represent the 55.089km record of Campenaerts.
If Dan Bigham were to pack up his 365W FTP, his CdA (which I have estimated) and travel to Adelaide, there was never sufficient atmospheric conditions during the last 30 years which would enable him to beat Campenaerts. In fact Adealaide was one of the slowest of all the velodromes considered.
The Centro Nacional de Alto Rendimiento (CNAR) in Mexico City is a velodrome that I struggled to find much evidence of its existence. It apparently hosted the 2013 Pan American track championships and there is this youtube video from USA cycling showing the team training on it. I am not sure if it is a permanent venue or something that was temporarily constructed for the event. At a massive altitude of 2200m and stable air pressure conditions, it has a very narrow distribution of hour record distances which always exceed Campenaerts. It had the highest median hour record distance of all the velodromes considered here, with a median distance of 56.63km.
Lastly the distances achieved at Hallenstadion in Zurich lie somewhere between the two locations discussed before. Its median value (55.007km) lies just below the record, but the record represents the 74th percentile of values in Zurich. Therefore slightly more than a quarter of the time in 1990-2019 a 365W Dan Bigham would break the hour record in Zurich (based on my various assumptions).
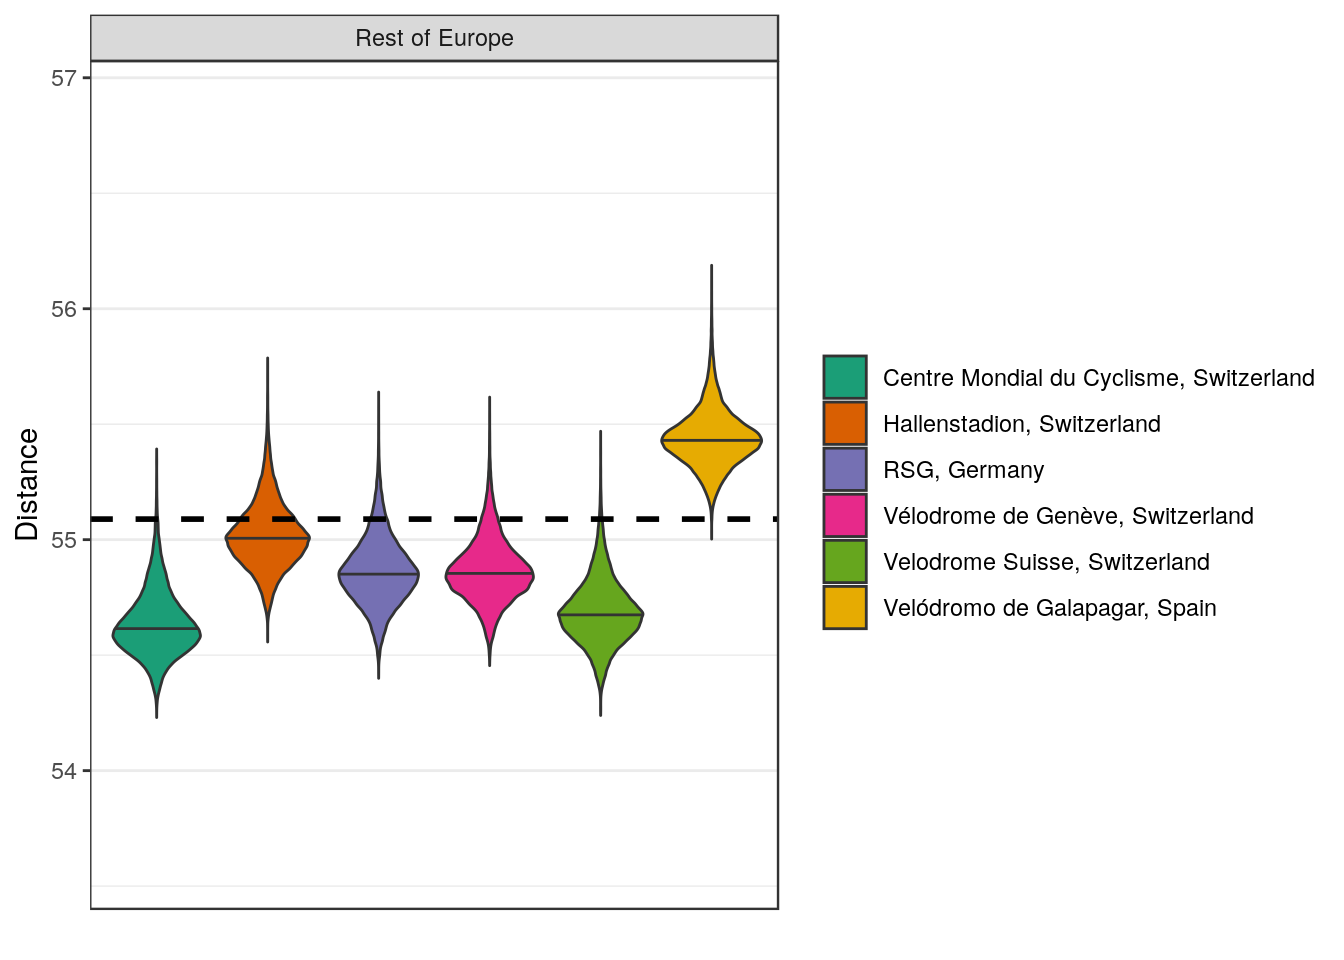
Given the fact that Dan’s recent attempt was at Grenchen. I decided to start with an overview of some velodromes around mainland Europe first. Similar values were found for all the Swiss velodromes and Augsburg in Germany. Hallenstadion in Zurich and Aigle had slightly higher and lower average distances (central line in violin) respectively. To varying degrees all 5 velodromes have values in the tails of their distributions that would break the record.
The other venue considered here is Velodromo de Galapagar in Madrid. It apparently is a location that could beat the record based on the atmospheric conditions, but it is a resin track (and a funky turquoise colour!) and I do not know if that surface is in any way comparable to a wooden track in terms of rolling resistance. If it is, its combination of altitude and favourable weather conditions would make it a viable option for an attempt.
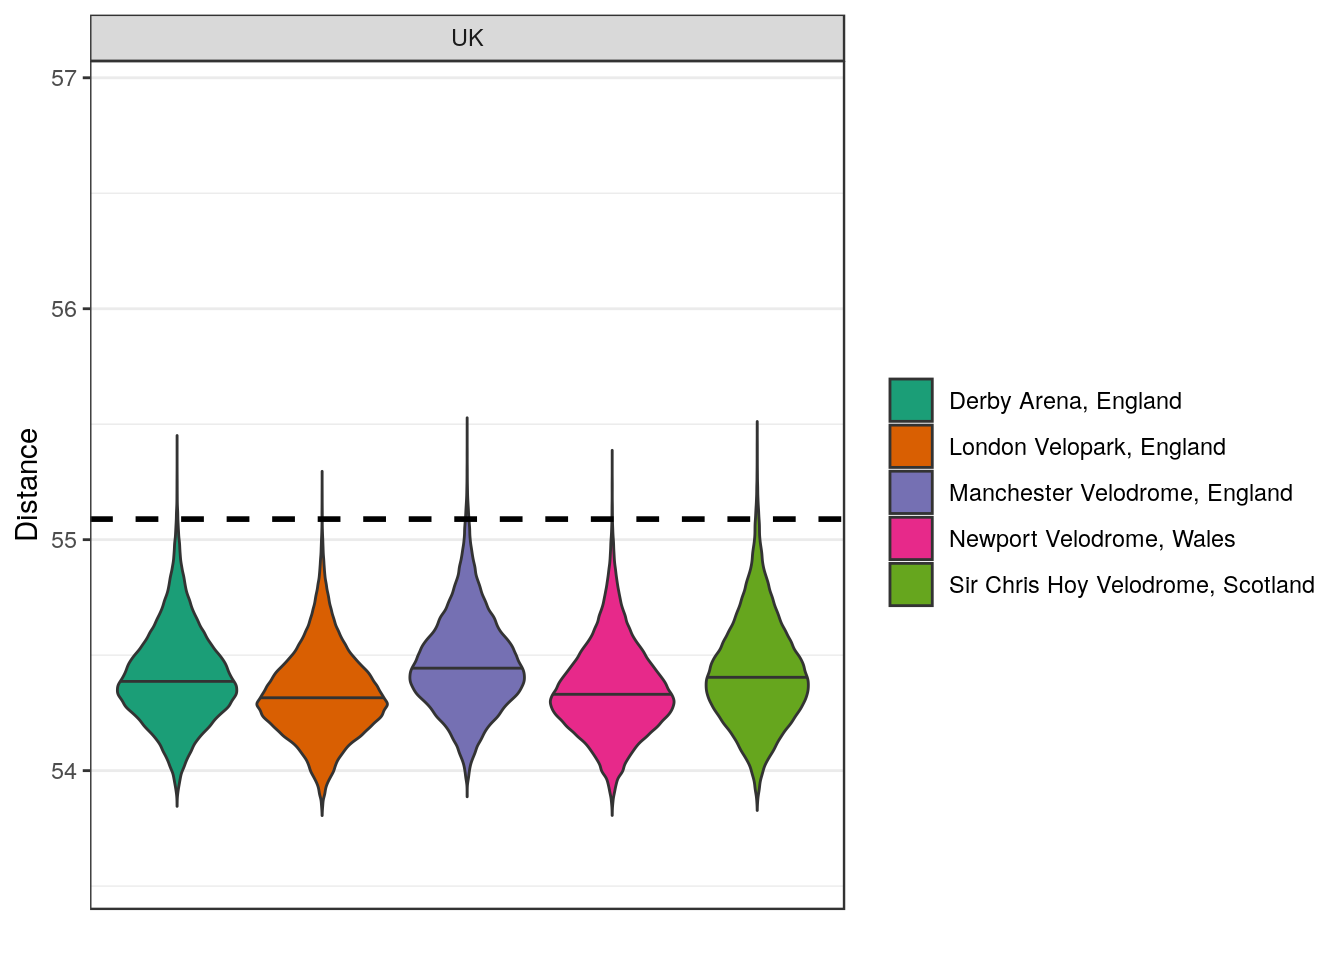
If Dan was to stay closer to home, things would become more difficult. There are lower median values at all locations but the variable nature of the UK weather means there are occasionally days when the record could be broken but also days when he could struggle to exceed 54km.
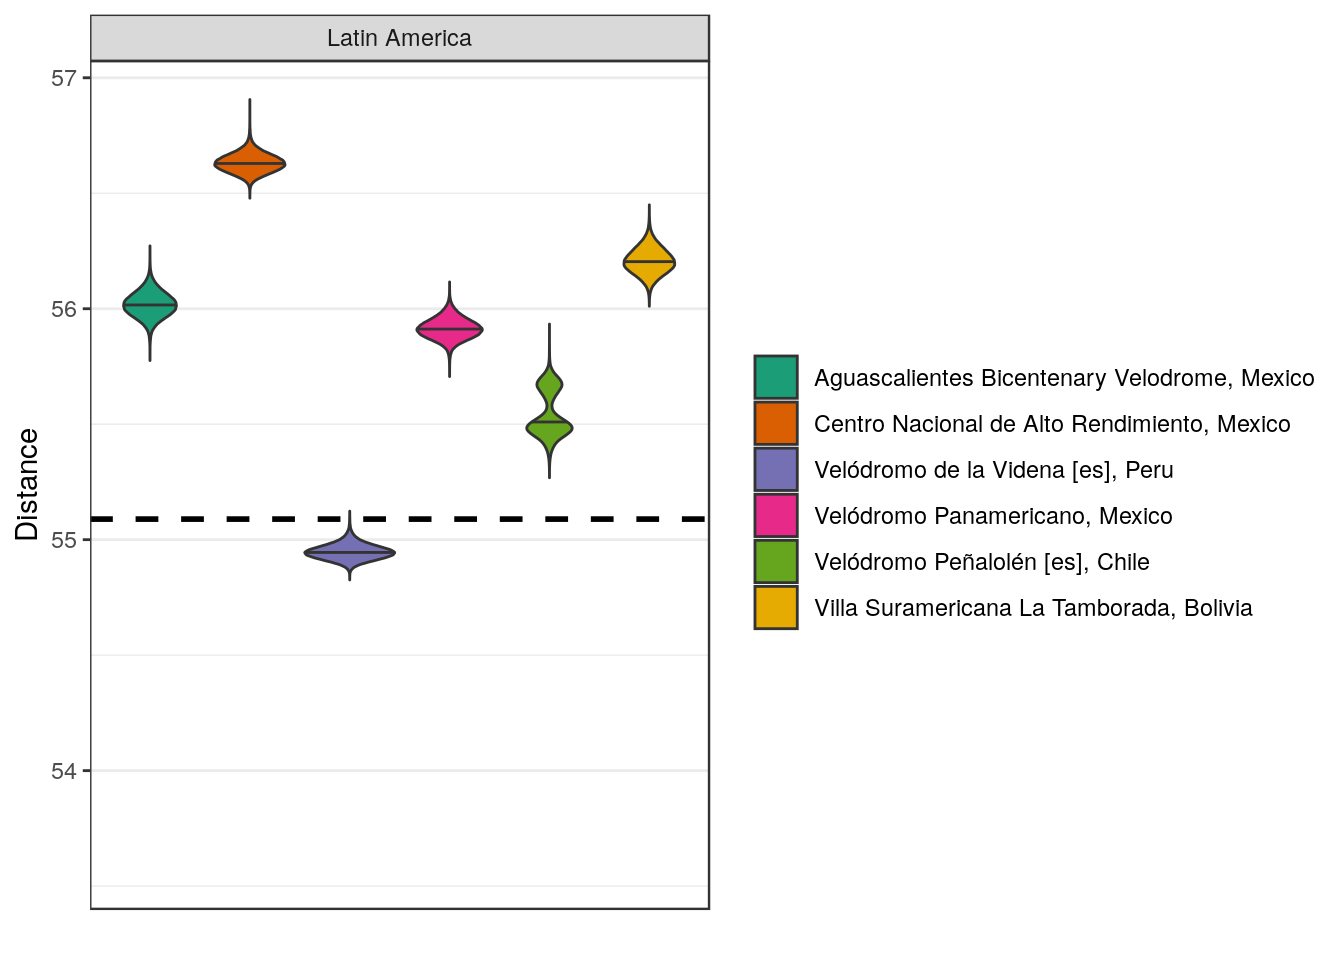
The natural next step, as Dan said himself recently, is to consider travelling to high altitude and the best options for that are in Latin America. There are five such location which offer a good chance of beating the record.
Three of the velodromes are in Mexico. The aforementioned CNAR (if it exists), Aguascalientes (where Campenaerts set his record and Alex Dowsett had a recent failed attempt) and Velodromo Panamericano in Guadalajara. With altitudes betweeen 1550-2200m, all would offer good conditions for a tilt at the hour record.
Of the South American velodromes, the Villa Suramericana La Tamborada in Bolivia and Santiago, Chile are also plausible locations to be confident of breaking the record. Although the distribution of values in Santiago has a bi-modal distribution (two peaks), which seems strange and is something I need to look into more.
Velodromo de la Videna in Lima is an interesting case. It has a higher median value than all of the UK velodromes but has very low variance and exceeds the record less often than any of those velodromes in the UK.
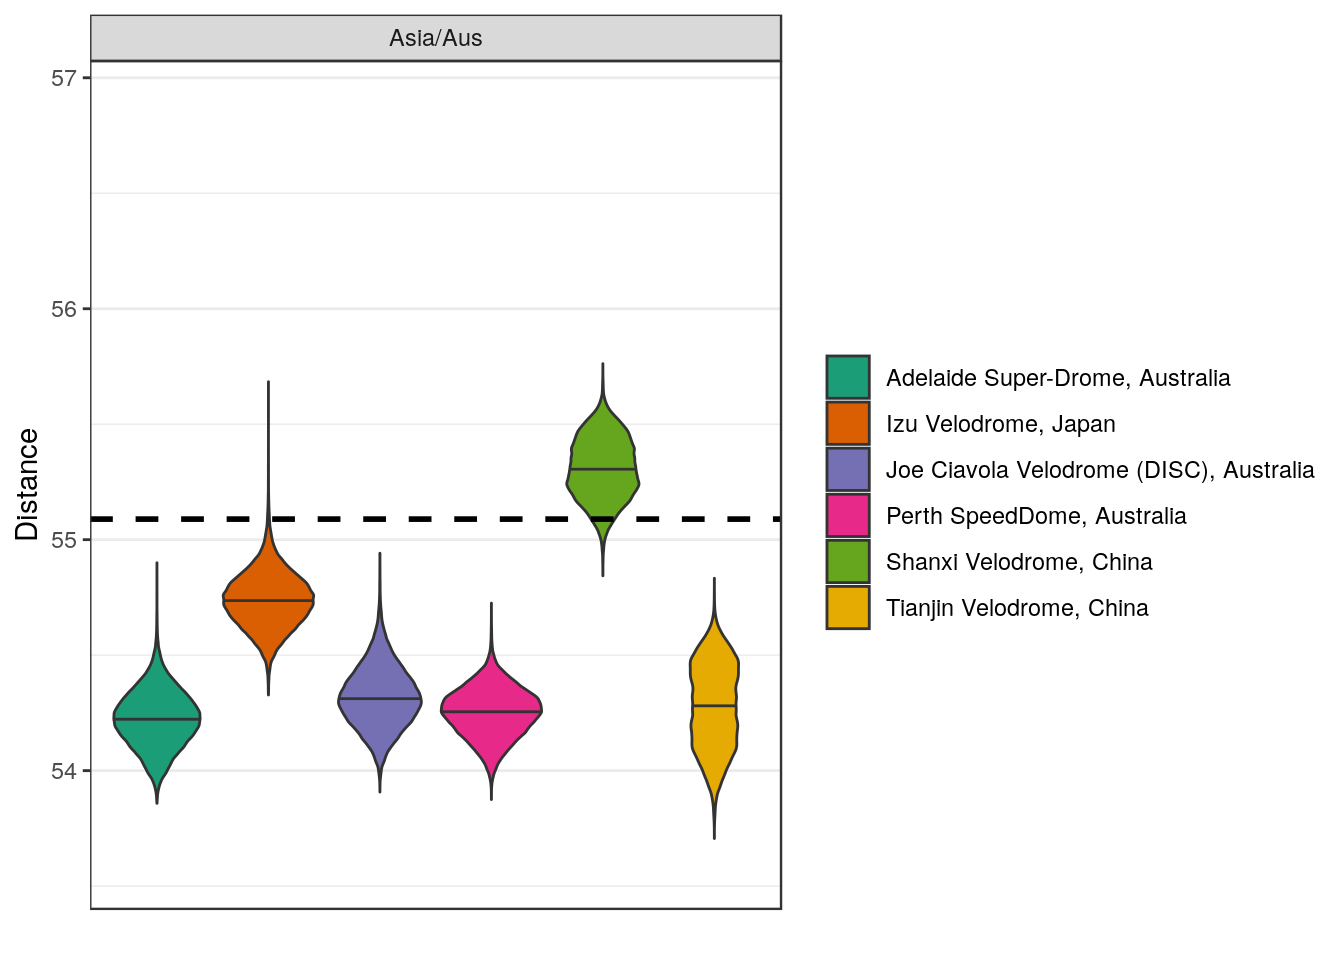
Looking further afield to Asia/Australia, Australian velodromes don’t offer much in the way of speed. There is more variability in Asia. Izu Velodrome in Japan has a very fat-tailed distribution, with an value that is very far from its median (should investigate more, might be during a typhoon). Meanwhile in China the Shanxi Velodrome in Taiyuan, Northern China is another location at altitude with median values above the record. While Tianjin is on the lower end, similar to the Australian locations.
Monthly Variability
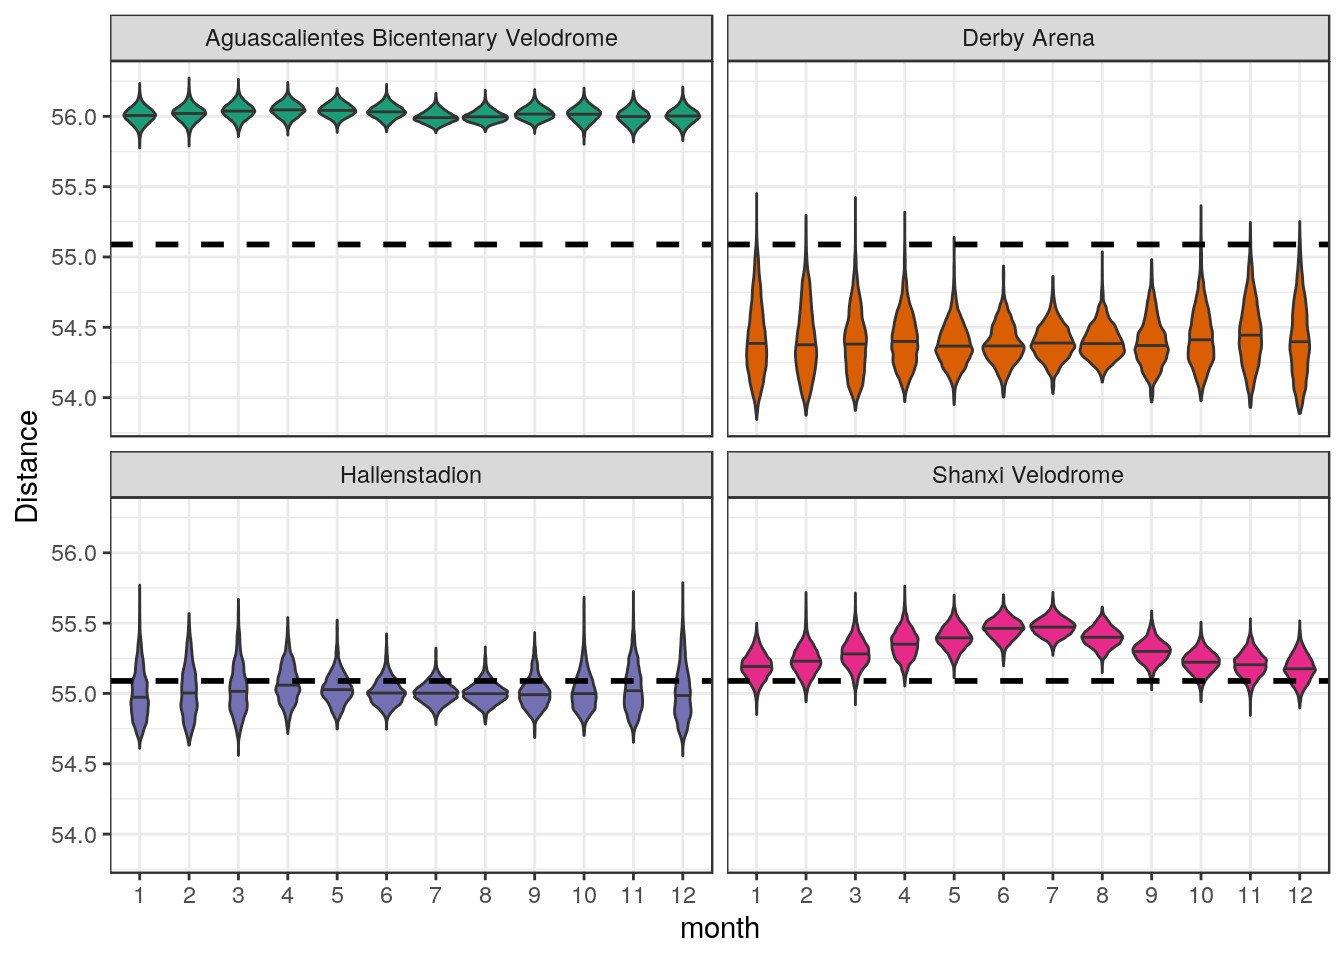
But it’s also not just simply a case of choosing a location and going whenever one fancies. The time of year might also need to be taken into consideration. At European locations like Derbados or Zurich, variability (and the likelihood of breaking the record) increases in winter and is lower in the summer. Conversely the best time to attempt an hour record at the Shanxi Velodrome is during the summer, when you would be more assured of breaking the record. Meanwhile there is very little month-to-month variability at Aguascalientes, with it being optimal to make an attempt at any point in the year.
Acclimatisation
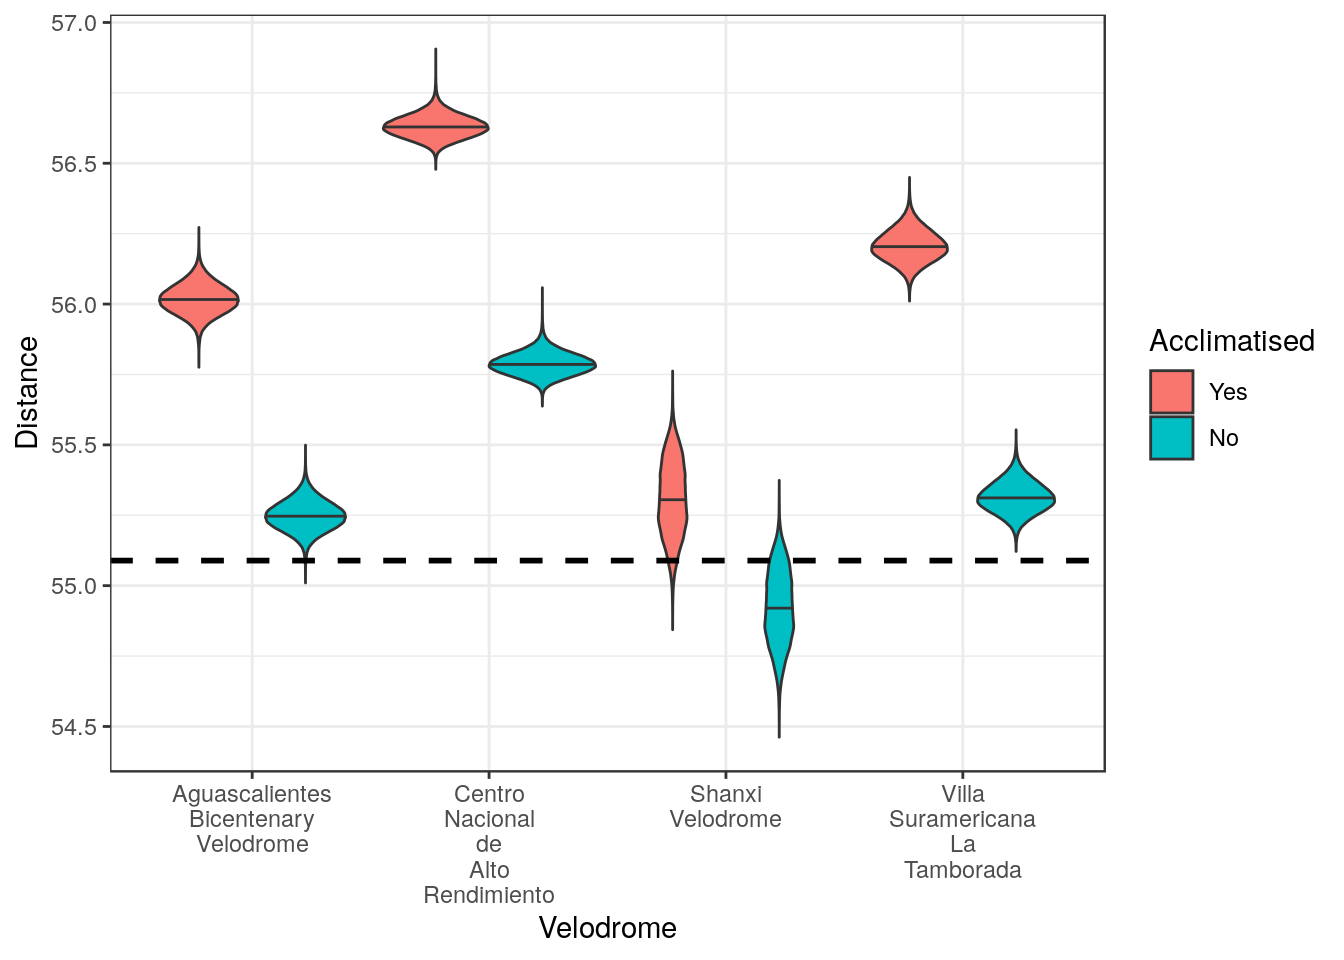
In all the previous plots I have used the power corrections in the Bassett paper for an acclimatised athlete. One would hope that Dan (or any other rider) can achieve this if one decides to go to altitude but things can always go wrong. The analysis was repeated using the unacclimatised values from the Bassett paper to adjust the FTP (shown in teal line earlier). The differences in outcomes for both scenarios are shown below for four velodromes.
The record would still be broken at both Aguascalientes and Bolivia, but it would be a much closer run thing. Meanwhile at Shanxi Velodrome, an unacclimatised 365W rider would likely miss out on breaking the record, compared to the acclimated rider who would expect to break the record 95% of the time. Clearly acclimatisation is a crucial element of attempting an hour record at altitude.
Conclusions
As seen above in the monthly plots at the Derby Arena, the best chance of exceeding the record in the UK happens during the winter months when surface pressure is most variable. This is shown below for an example around Christmas 2013, when multiple UK velodromes had conditions conducive to breaking the record. The graph is interactive: double clicking on the graph zooms out to a 7 year view of the data from 2013-2019. The graph can be zoomed in on by clicking and dragging on the graph.